US supermarket turf
14 March 2016

This is my final project for the Intermediate GIS class that I just finished. I’m just gonna dump everything into this post.
Classifying and Understanding Spatial Distributions of U.S. Supermarket Chains
INTRODUCTION AND BACKGROUND
A common problem in retail is the infringement of certain stores upon the “turf” of an established chain—businesses seek to establish, and maintain, market dominance within a particular physical area. The goals of this project are: (1) to identify the present-day turf of US supermarket chains; and (2) to establish a simple classification system for supermarket chains based on patterns in their turf. Such a classification would be important to investors, who want to quickly gain a broad understanding of a supermarket brand or chain. A classification system would also be useful for retail marketers who develop strategies for expansion, as well as business developers who wish to establish a specific geographical presence. With recent advances in GIS technology and big data collection, it is now possible to reach these goals using empirical methods.
Surprisingly, despite the rapid rise in popularity of so-called “retail geography”, there have been no scholarly attempts to map out the territories controlled by supermarket chains, or to create general classification schemes. Individual chains, however—especially Walmart—have been studied fairly extensively. Paul Ellickson and Paul Grieco have written about how Walmart’s entry into grocery retailing leads to a highly localized but pronounced decline in business among competing stores; though primarily large chains rather than small businesses are affected.1 “Territory planning” is the term used in the book Retail Geography and Intelligent Network Planning to describe macro-scale geographic targeting for retail.2 Much more research has gone into micro-level analysis on the scale of individual stores and determining optimal locations.
DATA AND METHODS
In order to map out supermarket territory, the most crucial data are the locations of stores. These data are not easy to come by for free—AggData offer complete location datasets for most chains, but the typical cost is $50 per chain. In order to obtain these locations for free, I looked to OpenStreetMap (OSM). Using Overpass Turbo, which is a web-based data mining tool that uses Overpass API, I extracted the location of every supermarket in a given state, for all 48 contiguous states. Since OSM is a user-created resource, the supermarket data was not fully complete, especially for rural areas or smaller towns. However, it would suffice for this analysis. Once the supermarkets had been extracted, I loaded the KML files into ArcMap and merged all the individual states into three national regions (west, central, east). I avoided one huge dataset in order to speed up processing time. Exporting the attribute table for each shapefile into R, I used a count to determine the most common chains, removing small chains (< 30 locations) and standalone stores. The end result was a table containing the ID, name, X and Y coordinates of every big-chain supermarket in the US. I used census shapefiles for major cities and state outlines.
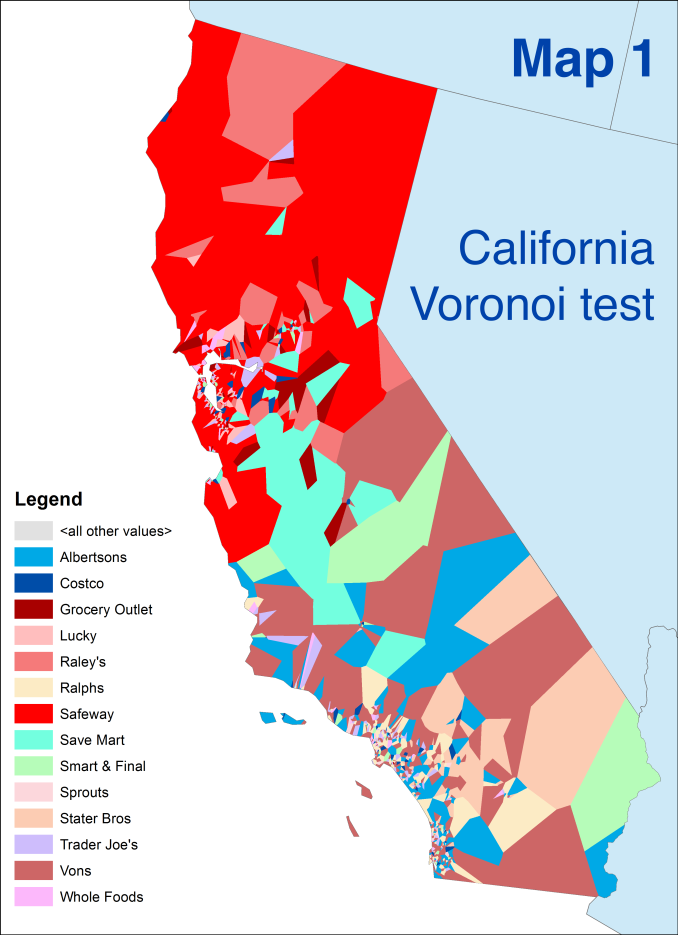
I saw two approaches for generating a turf map of supermarkets. The first was to create a Voronoi with all the points, and then to dissolve it based on the “name” field of the attribute table. For the state of California, this leads to the results shown in Map 1. While it produces a beautiful and intricate map, there are several problems with this method.
In creating the classification scheme, I plotted each chain’s territory (in raster cells) against the number of locations that the chain officially reported to have. Looking at territory on a logarithmic scale, this led to several natural clusters. When I took these clusters and combined them with general observations of supermarket chains, a consistent and intuitive classification scheme emerged. Admittedly, there was some holistic basis in coming up with groupings. But the result (Chart 1) is so remarkably consistent, that it would not be hard to come up with quantitative ways of getting the same result.
RESULTS
Chart 1 shows four categories of supermarkets: Sharks, Big Fish, Minnows and Shadows. The Minnows category is split into two subgroups for ease of display (Maps 4, 5).
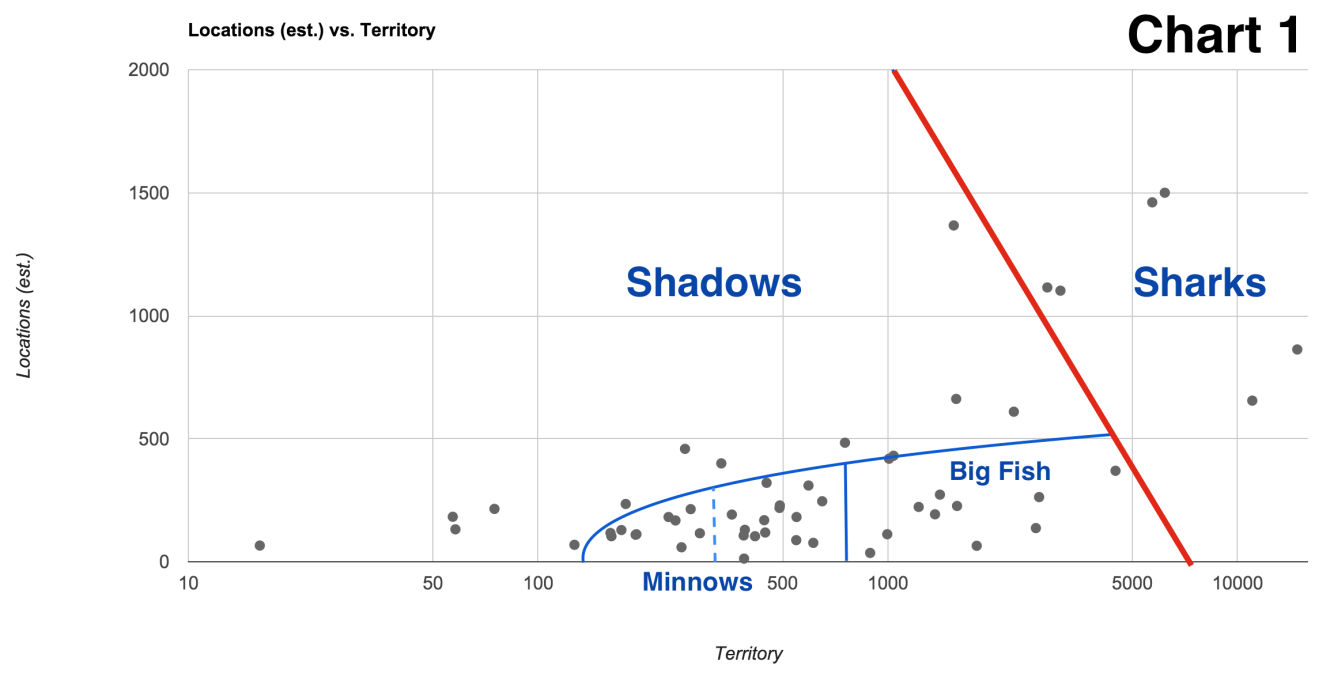
In general, the Sharks are the largest chains, with the greatest territory and most locations. Big Fish are influential, but don’t venture outside their region of the United States. Minnows are only dominant in one metropolitan area or ultra-specific region. Shadows may be large chains, but for a variety of reasons exhibit lower than expected dominance. Each category is shown on a separate map, due to the high number of chains.
Category 1: Sharks (Map 2)
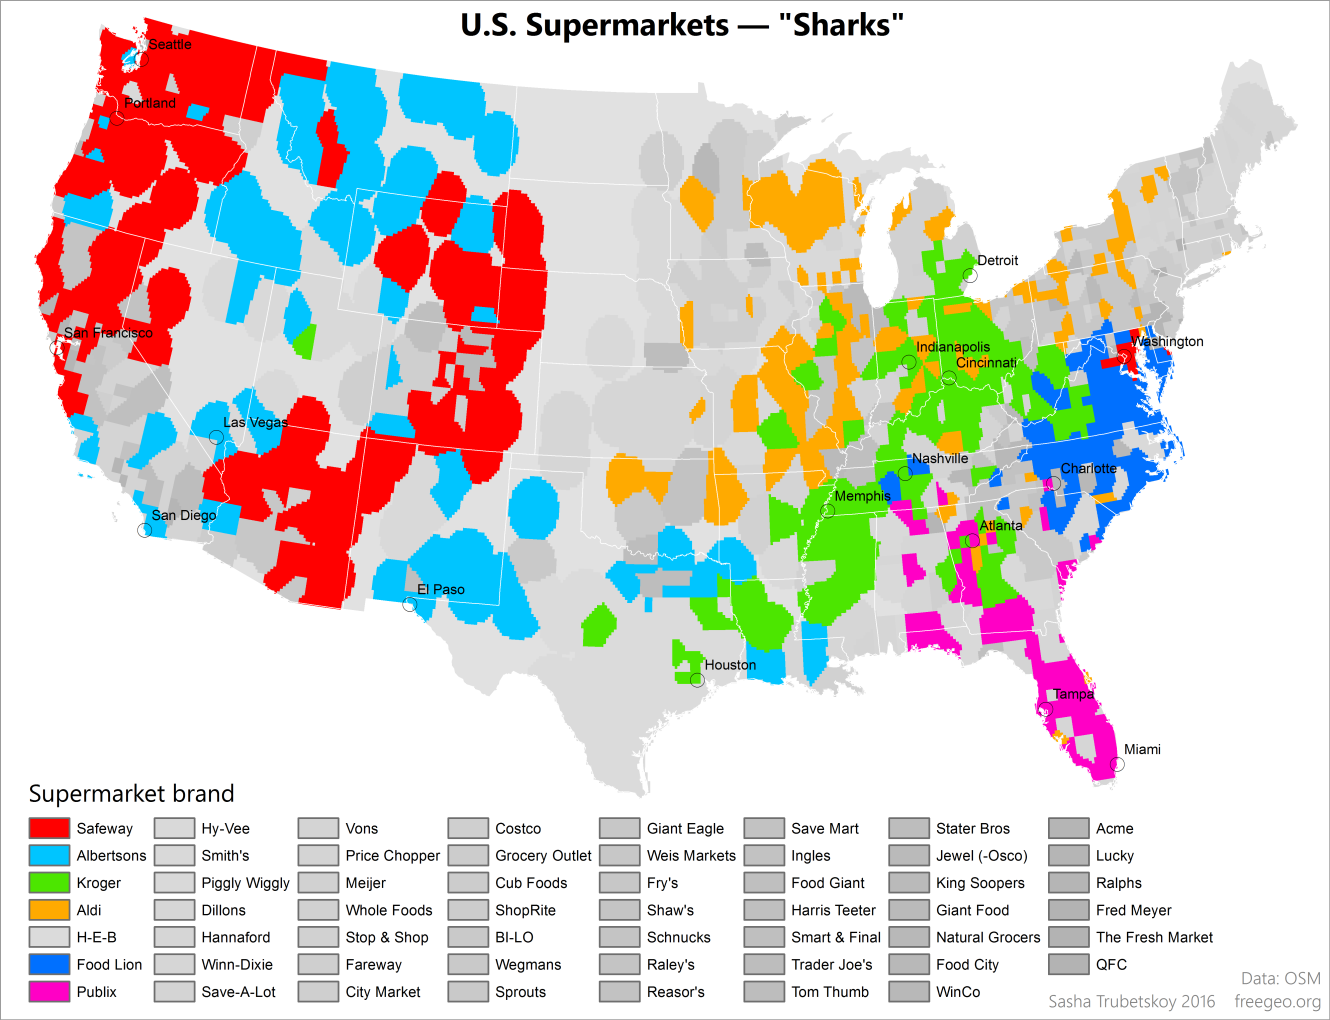
The Sharks are very much what their name implies. They are by far the largest, most widespread and most dominant supermarket chains in the US. This is the most exclusive category, with only six members: Aldi, Kroger, Safeway, Albertsons, Food Lion and Publix. The latter two, whose dots on the chart are closest to the red line, are more regional in nature. Sharks are the “apex predators” of the supermarket scene, constantly swallowing up smaller chains. Their turf is shown below in Map 2.
Category 2: Big Fish (Map 3)
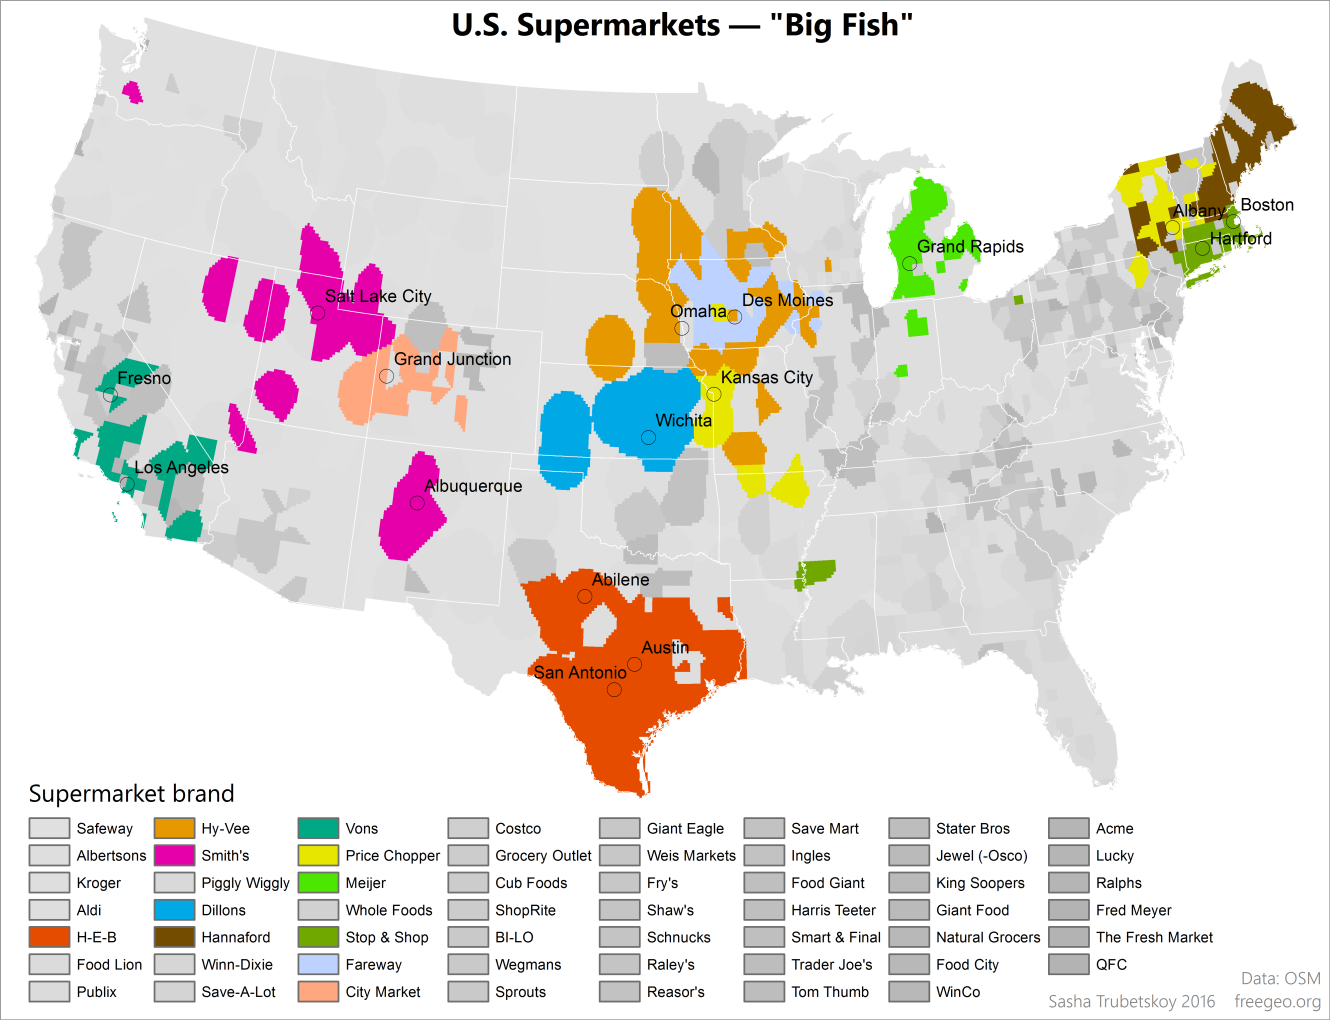
The Big Fish are more limited in geographic scope than Sharks; while dominant in their traditional region, they seldom stray outside of it. These chains have a high ratio of territory to store count, which is a direct consequence of their focus on a particular region. Some Big Fish, like Vons, Smith’s and Dillons, are actually subsidiaries of Shark corporations that continue to operate under their old names. Others, like Hy-Vee and H-E-B, are proud of their home-grown status.
Category 3: Minnows (Maps 4, 5)
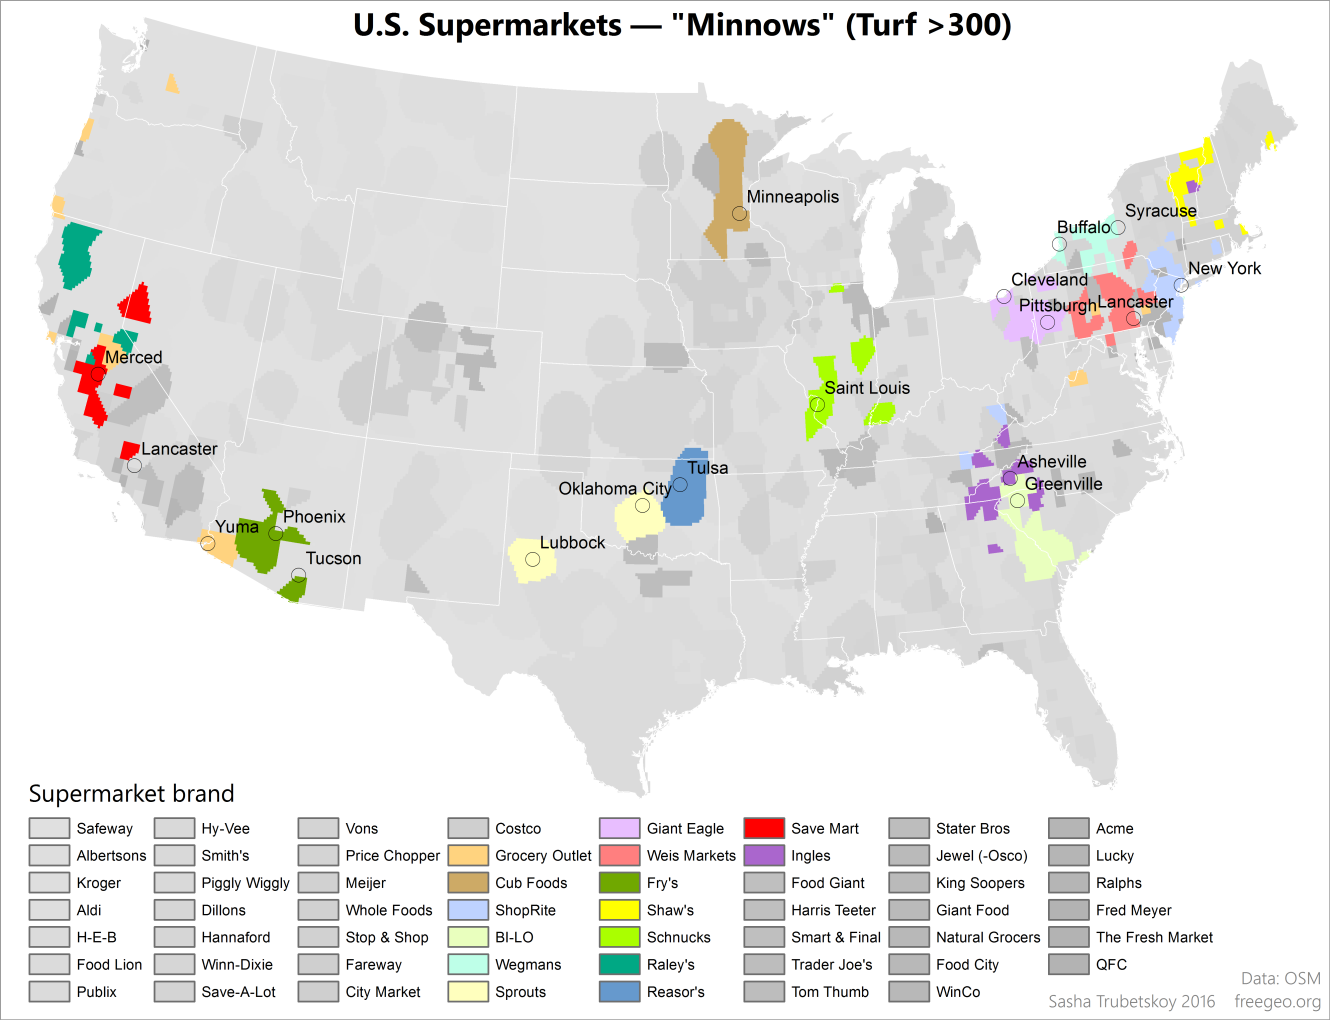
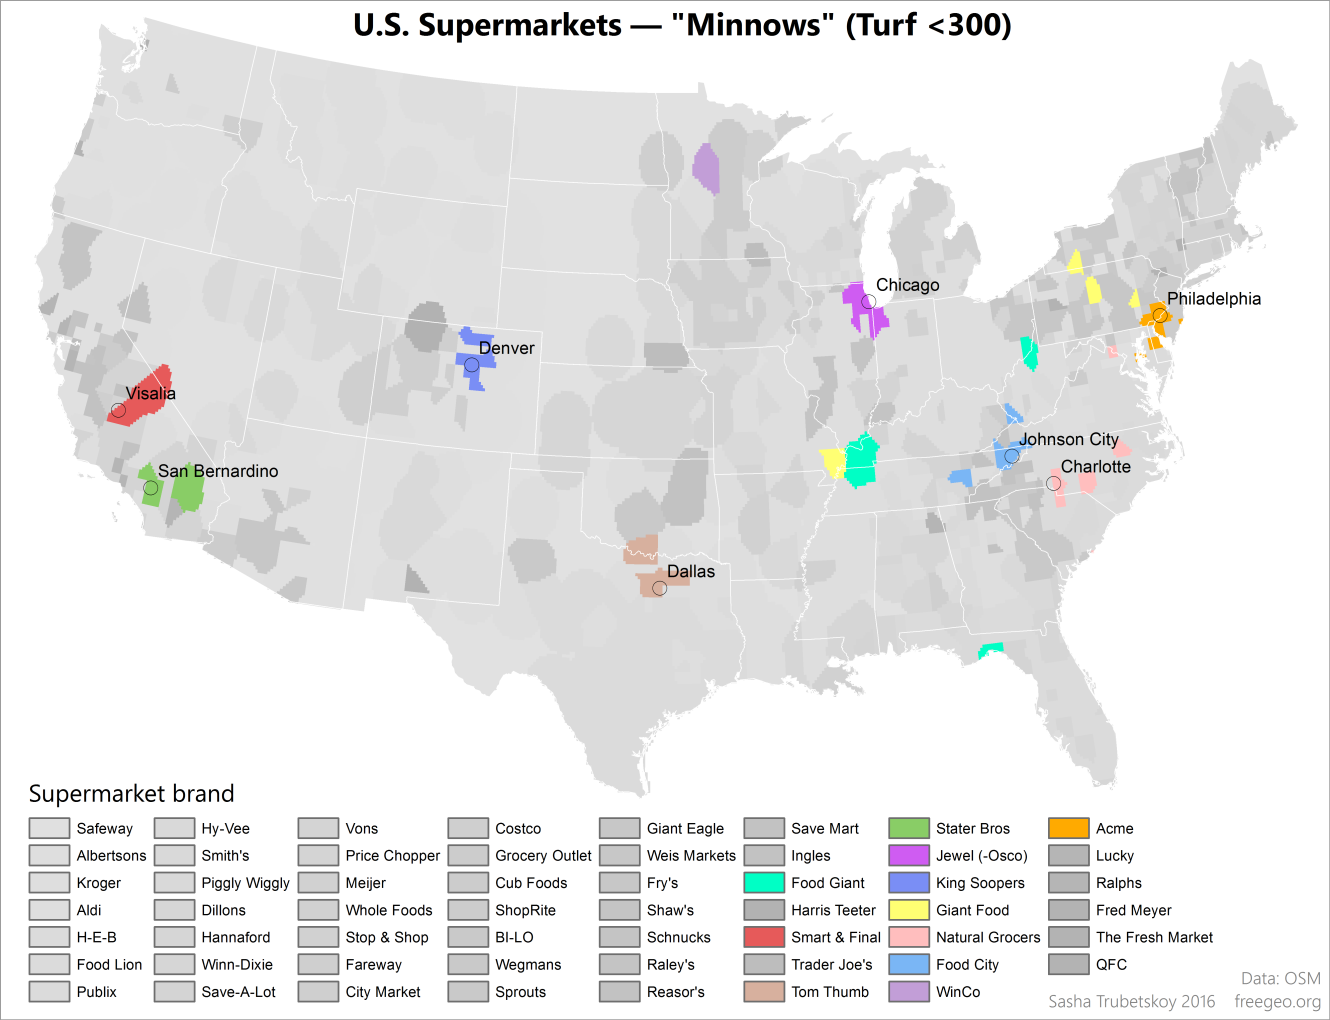
The Minnows are a variety of smaller chains. Despite their name, Minnows may actually have upwards of 200 stores. However, their distinguishing feature is that they are highly concentrated, and only dominate one metro area (or other small region). They are frequently owned by Sharks, though many operate independently.
Category 4: Shadows (Map 6)

The Shadows are a very diverse group, ranging from large interstate chains to more localized ones. What the Shadows all have in common is that they exist “in the shadow” of a larger, more dominant chain. The causes may differ. Chains like Costco, Whole Foods and Trader Joe’s are spread nationally, but fill specialty markets and are not dominant anywhere in particular. Lucky or Ralphs are highly localized but nonetheless overshadowed by larger companies, in this case Safeway/Vons and Albertsons. Most of the Shadows’ turf is accidental or insignificant, an artifact of my methodology.
CONCLUSION
Using raster analysis techniques on a dataset containing major US supermarkets, we were just able to map out areas where major US chains are predominant. By analyzing the distribution of territory (in raster cells) versus number of stores, we have created a system to categorize chains into Sharks, Big Fish, Minnows and Shadows. Each category has a set of common characteristics that would be useful to an investor or businessman who wishes to quickly ascertain spatial strategies and general information about these chains. A more in-depth analysis in the future, possibly adding a time dimension or demographic information, would allow for an even more insightful classification scheme.