Voting patterns in Europe
1 January 2015
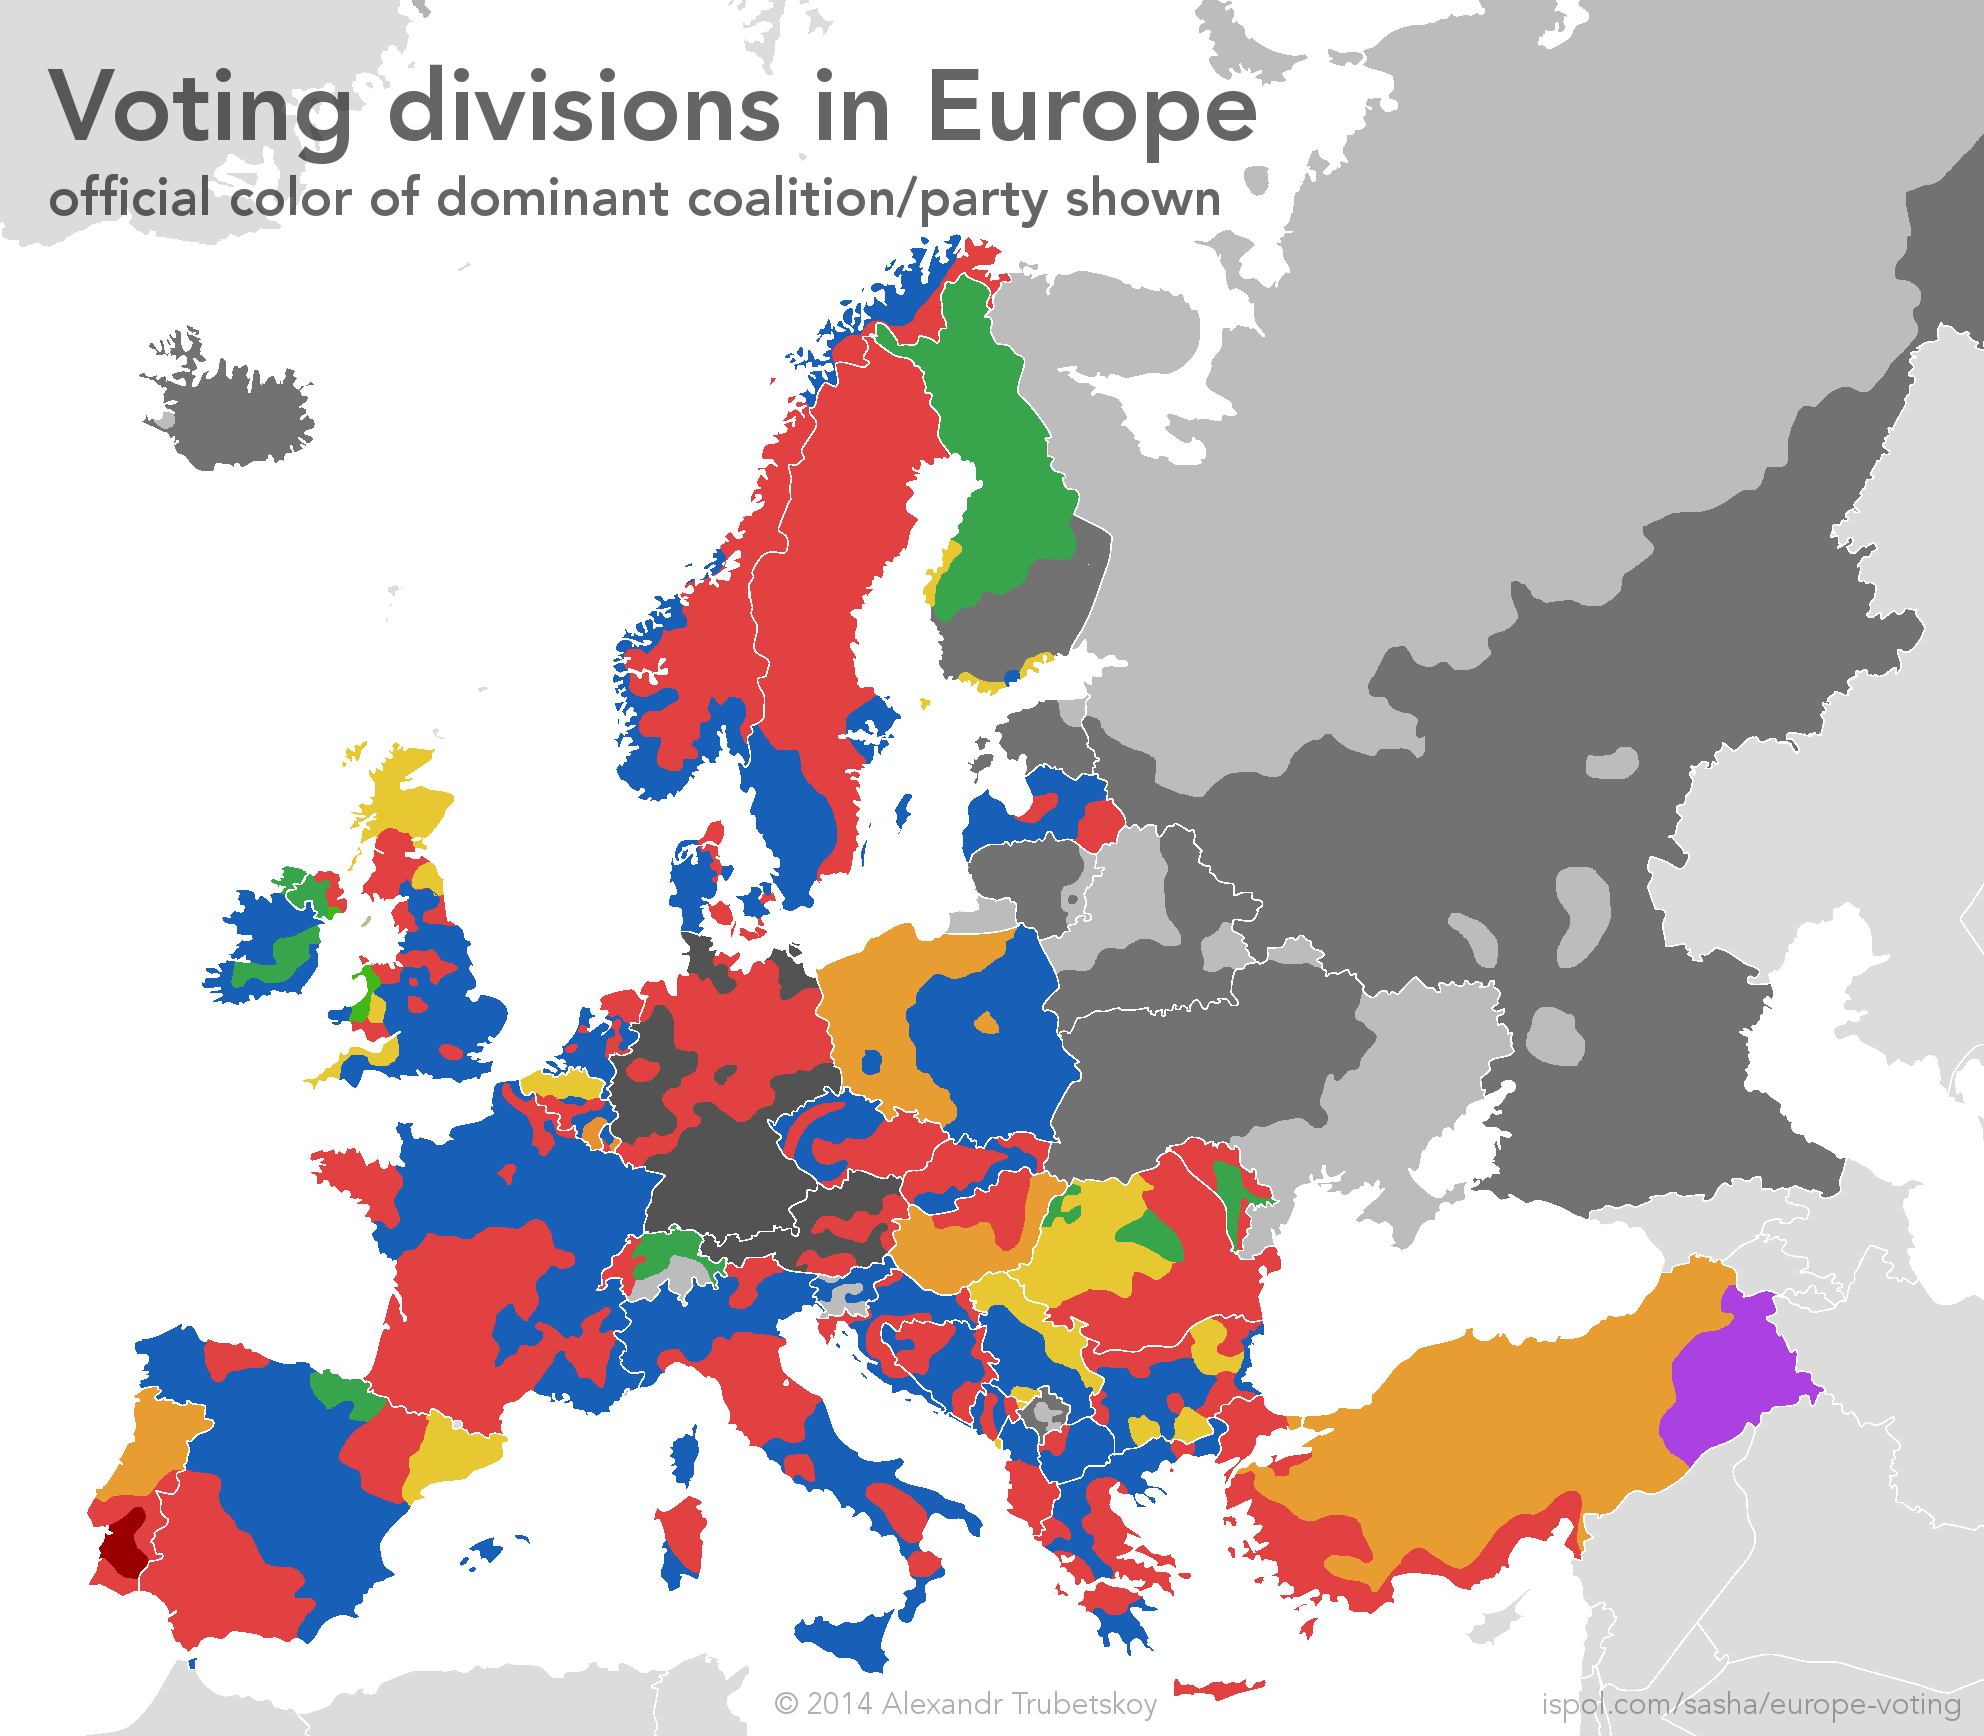
This map shows how voting divides in individual European countries cross national boundaries and have some interesting correlations.
The map speaks for itself—each color on the map is the color of the dominant/winning political party or coalition (if political parties change unreliably). In Europe, red is typically the color of leftist or socialist coalitions, while blue is typically for right-of-center or populist parties. This is opposite of the typical color scheme in the United States, where red (Republicans) is typically right, while blue (Democrats) is typically left.
The boundaries on the map are largely based on the past 10-15 years of elections, although in many cases these patterns go back much longer. In some countries, voting patterns are not tied to political parties or coalitions. Countries with grey areas do not have ideologically-aligned regions, or have special circumstances, as explained below:
- In Switzerland, the southern region receives both “FDP-The Liberals” votes, and Christian-Democratic People’s Party votes, with a mixed ideology that does not match the French or German regions. This region roughly corresponds to Italian-speaking areas, although includes other towns as well.
- In Finland, the grey area is split between the National Coalition (right) and Social Democratic (left) parties. There is somewhat of a pattern, but it is not distinct enough for me to include on the map. Finnish people are welcome to contact me and suggest how the divide could be illustrated!
- In Estonia, Estonian-speaking parts are divided rather randomly between Reform, IRL and SDE parties. The only real divide is the Russian population, which overwhelmingly votes for the Center Party (Kesk).
- In Lithuania, presidential voting is fairly monolithic and parliamentary voting does not follow a consistent pattern. However, the Lithuanian Polish population represents a visible voting bloc, as indicated on the map.
- Belarus has not had a competitive election since 1994, with Alexander Lukashenko winning overwhelmingly since then. However, looking at regions where Lukashenko won but received less votes, one can still establish a pattern, as shown.
- Ukraine is in the midst of a significant crisis, and the 2014 elections did not accurately represent the political picture of all Ukrainian citizens, particularly those in the East. To construct the division on the map, the 2010 election (and prior ones) were used. The darker grey is the area with the greatest Ukrainian nationalist support, voting for Fatherland (“Batkivshyna”, pro-Europe, anti Russian language) in 2012, Yulia Tymoshenko in 2010, Viktor Yuschenko in 2004. The lightest grey area contains significant numbers of ethnic Russians and is predominantly Russian-speaking in everyday language and local business. This area supported Viktor Yanukovich in 2010 and 2004. Because information was taken from elections prior to 2014, the Crimea peninsula is indicated as part of Ukraine, despite currently being adminstered by the Russian Federation.
- While elections in Russia have been marred with controversy (with many offering statistical proof of vote falsification), I used official results in creating the voting divide due to the difficulty of obtaining more statistically sound results. That being said, vote rigging/fraud does not have an impact on the location of the election boundary. Elections were analyzed from the years 2012, 2008, 2004, 2000 and 1996. Prior to 2004, the northern section offered relatively more support to Vladimir Putin and affiliated parties (inc. United Russia), while the south voted more for the Communist Party under Gennady Zyuganov. In more recent elections, the north tended to disfavor Putin and support Mikhail Prokhorov (Independent) more widely, particularly urban Moscow. The Communists continue to receive wider support in the south, and parties like LDPR currently have greater percentages in the north. More details in the case study below.
- Since Kosovo is such a young government, the election patterns are not very well established and my data is rather limited. However, as of now, the division seems to be what I have on the map. The darker grey is the Democratic League of Kosovo, while the lighter is the opposition of Serbian minorities and the Democratic Party (formerly Kosovo Liberation Army).
- Iceland is divided between Reykjavik and the countryside, with Reykjavik leaning left and the country leaning right. However, since Iceland has a multitude of parties and coalitions, there were no appropriate colors to choose that were not misleading, so I had to go with grey.