Low-effort maps Jan 2019
31 January 2019
The following are some low-effort maps I made in January 2019 that did not involve any number crunching or many hours of design work. I still think they are aesthetically good or interesting, so I sharing them here, all in one post.
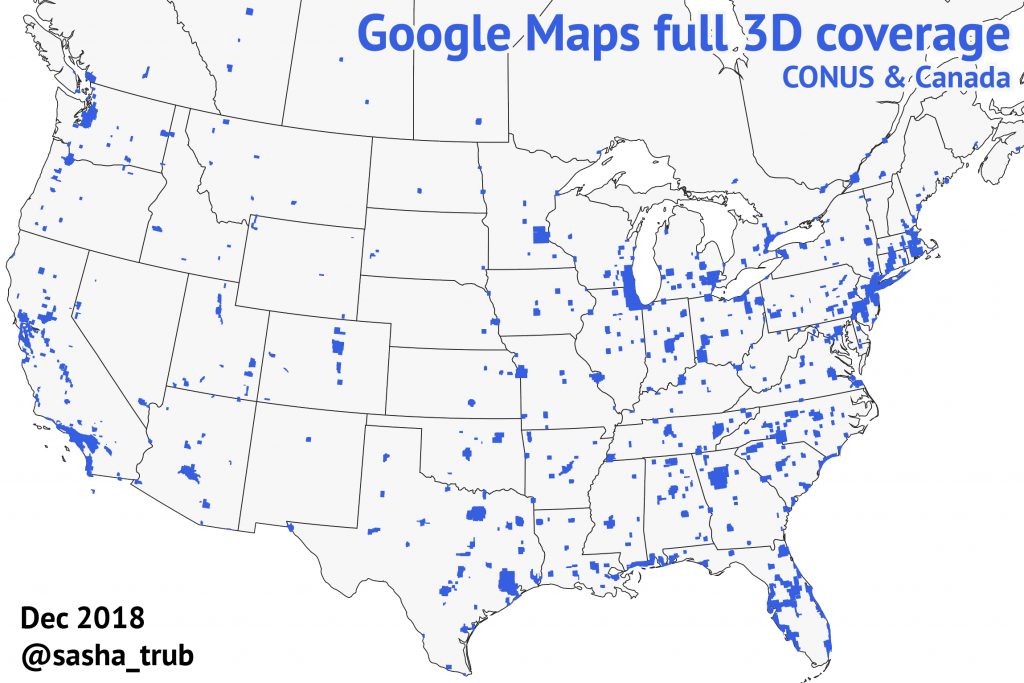
Created in December 2018, shared on 31 January 2019.
Data source: Google Earth Blog ( click here to download KML file)
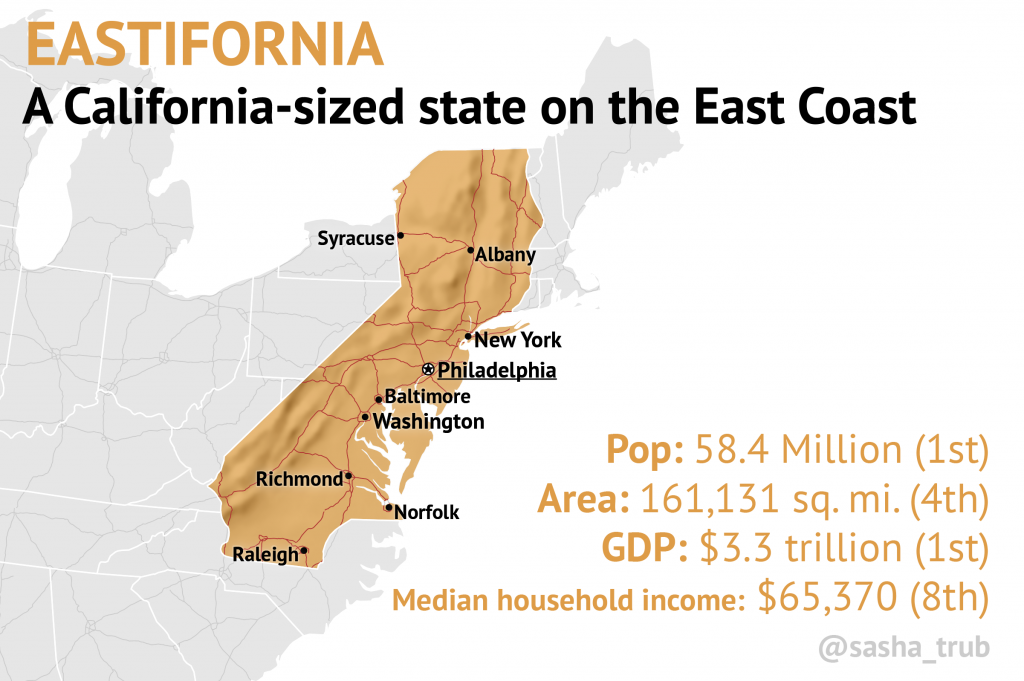
Created and shared on 30 January 2019.
Data sources:
- Population calculated by adding 2018 county populations from Census Bureau,
- Land area calculated ellipsoidally in QGIS,
- GDP estimated roughly based on latest data by state and metro area via Wikipedia
- Household income estimated roughly based on latest state-level per capita data via Wikipedia
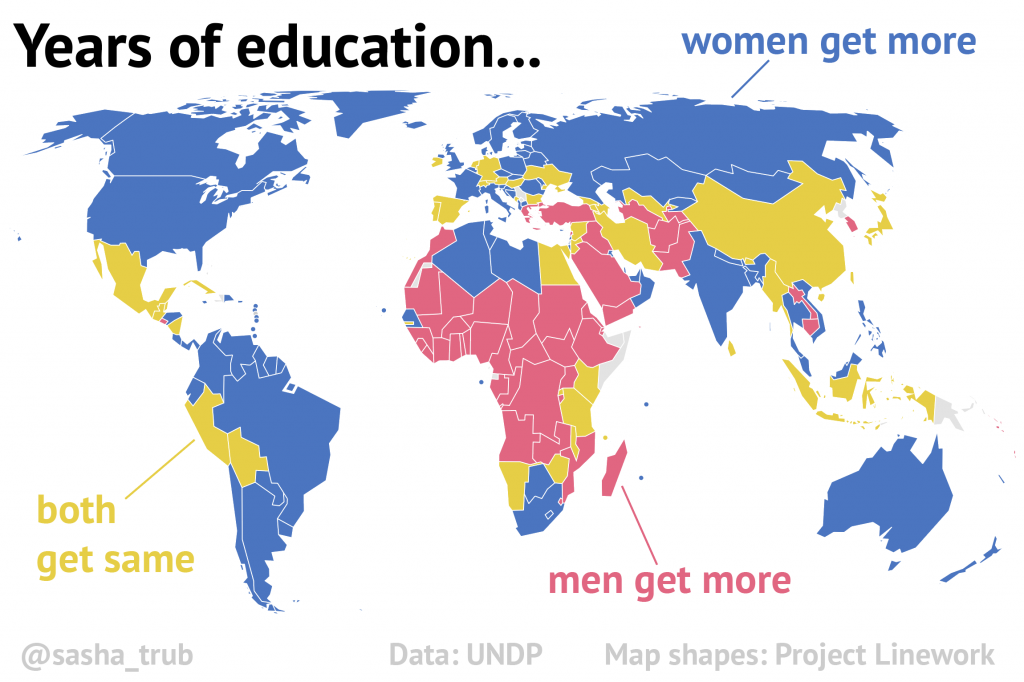
Created on 29 January 2019 and shared on 30 January 2019
Data from the United Nations Development Programme ( source for males, source for females)
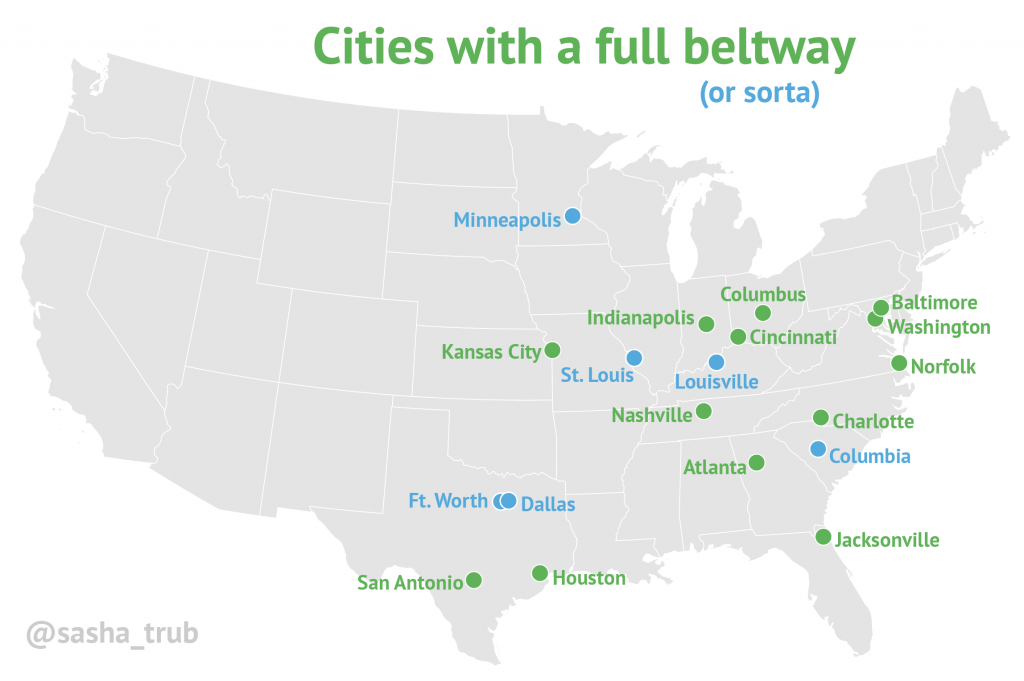
Created and shared on 27 January 2019
“Data” from visual inspection of maps for major US cities.
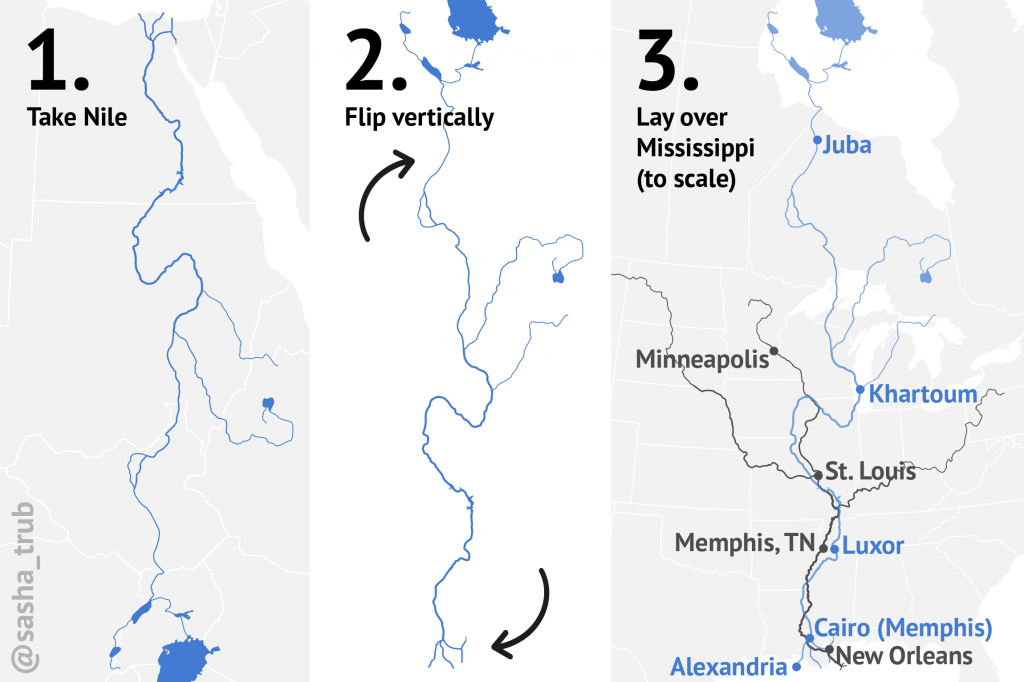
Created and shared on 26 January 2019
Data come from Natural Earth river shapefiles and manual placement of cities.