Valuable Squares revisited
9 October 2016
Here is a version with labels.
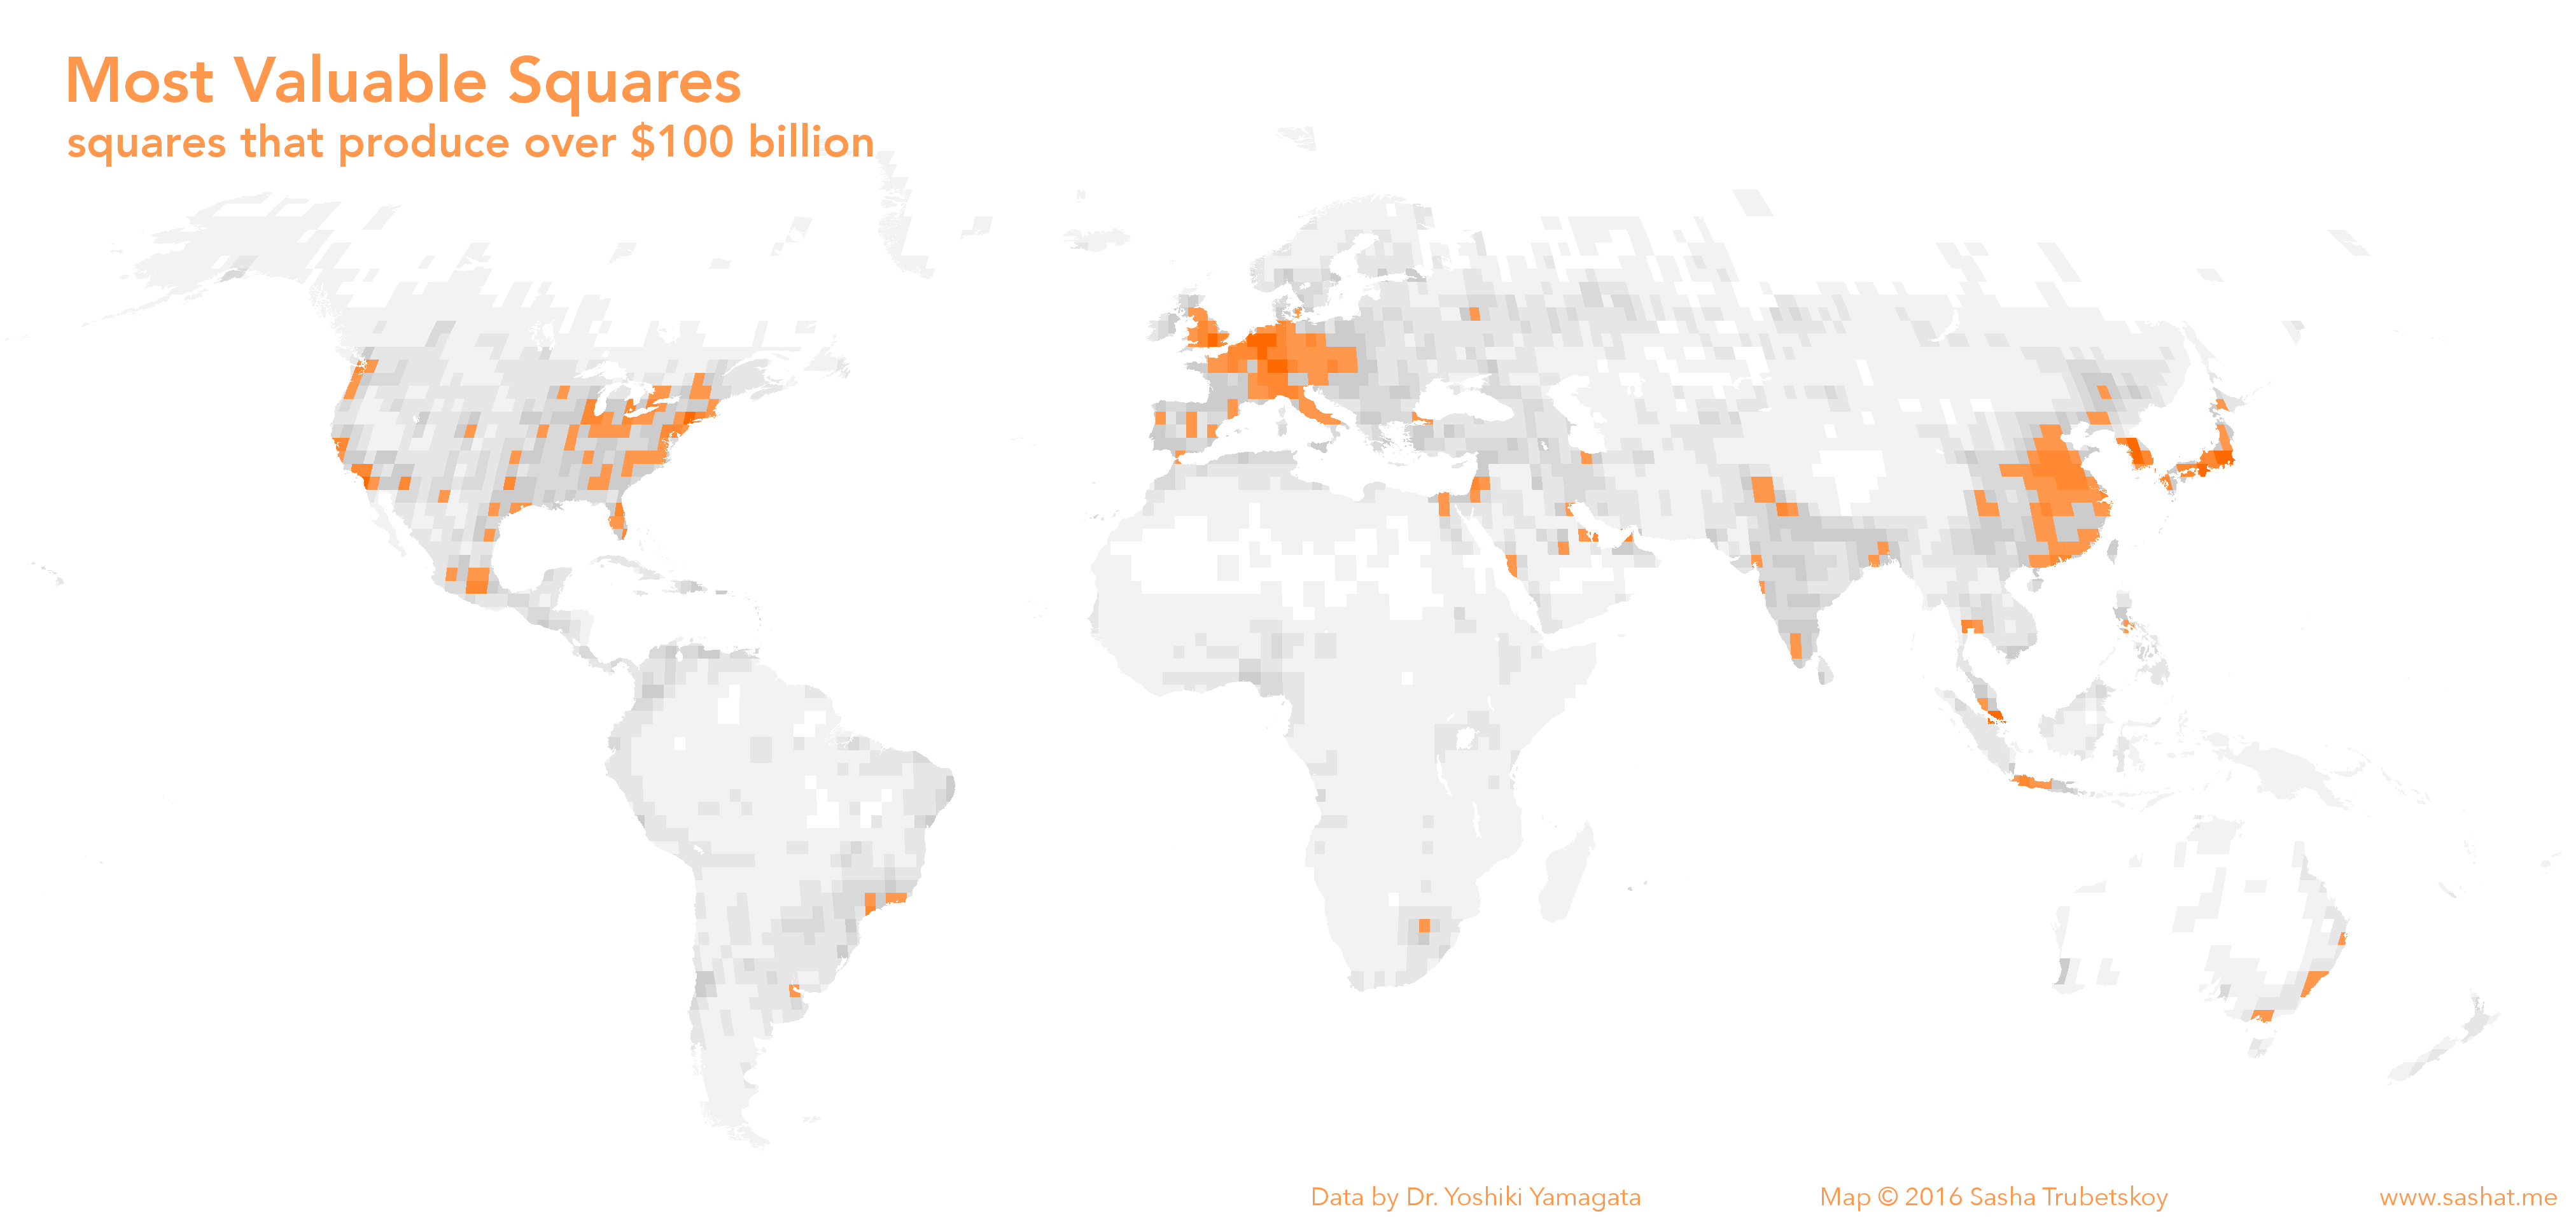
Previously I published a map that divided the world into around 18,000 squares, and highlighted which squares had a GDP of $100 billion or more. I decided to revisit this concept with the help of GIS software and slightly better data.
Data and method
The data come courtesy of Dr. Yoshiki Yamagata of Japan’s National Institute for Environmental Studies. The process was relatively simple. I took the 2010 GDP data and joined it to Dr. Yamagata’s grid. Then I spatially joined the grid to my less-granular fishnet of larger squares. The end result beautifully shows the world’s economic powerhouses.
Notes
Some cities were split in half by the grid, even though they would have a GDP of over $100 billion. Here are the hundred billion dollar cities that were left out:
- Stockholm, Sweden
- Santiago, Chile
- Lisbon, Portugal
- Taipei, Taiwan
The GDP numbers are not adjusted for purchasing power parity. Also, the original GDP data was downscaled without regard to rural-urban income breakdown. This means that the GDP of dense rural areas such as the North China Plain are slightly overestimated. When comparing data with other estimates by Brookings and the World Bank, it becomes clear that this difference is not very significant.