Wisconsin 2020: popular ways of detecting election fraud
15 November 2020
There are many popular methods of analyzing election results to see if there was any fraudulent behavior. My first introduction to these analyses came in the form of viral articles, shared by friends and family, proclaiming proof that the latest election in Russia was rigged. Now I will try to gather up all these methods in one blog post, and test them out on unofficial results from the 2020 presidential election in the state of Wisconsin.
The data
For this analysis, I’m using election results from Wisconsin’s five largest counties - Milwaukee, Dane, Waukesha, Brown and Racine counties. Together they account for 1,185,200 votes, which is about a third of all votes cast in Wisconsin in the 2020 election.
The reason I only use a handful of counties is because, as of right now, the election results are reported by county governments and there is no unified source for all of Wisconsin. Needless to say, I needed to do a lot of data cleaning to get these numbers.
The methods
1. Benford’s Law
This method has always been popular because it is so simple. More recently, it has gained traction among supporters of Trump, who point out that Biden’s vote totals in Chicago precincts do not follow Benford’s Law. They claim this is evidence of fraud.
What is Benford’s Law?
Benford’s Law is the observation that many real-world sets of numbers follow a certain pattern, if you look at the distribution of the first or second digit. The pattern is often found in sets of numbers that are randomly generated and span multiple powers of 10.
The most popular version of Benford’s Law applies to the first digit. As shown in the chart below, we expect 1 to be the first digit 30% of the time, 2 to be the first digit 18% of the time, and so on:

For an explanation of why this happens, I was very happy with what Wikipedia said, and I’m sure there are many great YouTube videos as well.
Benford’s Law in Wisconsin
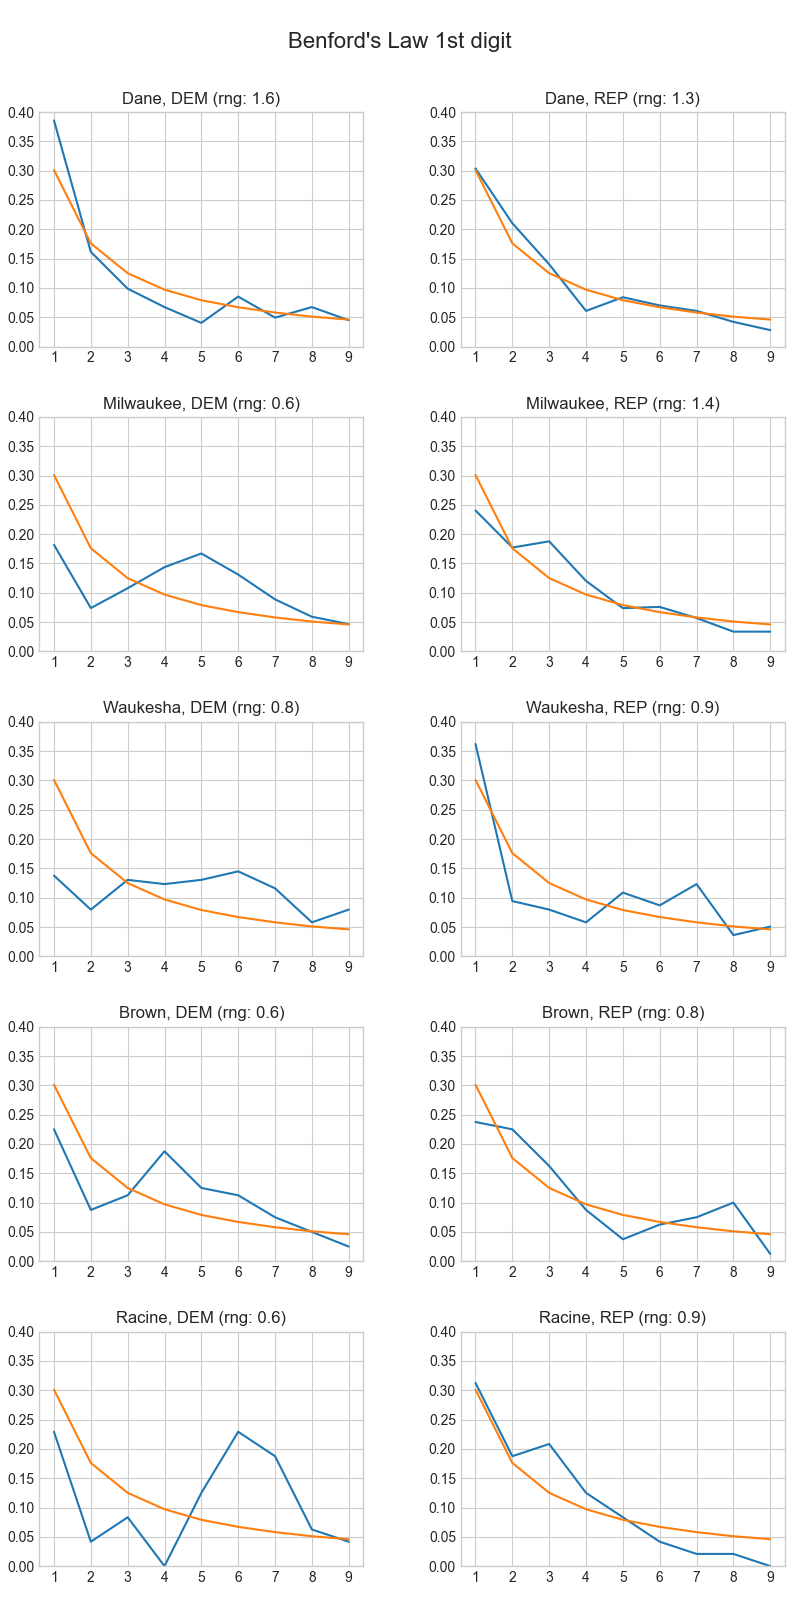
What happens if we plot the actual distributions of the first digit (blue) against the ideal Benford distribution (orange), for each party in each county?
The Republican numbers seem to match the ideal distribution fairly well. The Democrat numbers, on the other hand, deviate quite a bit with the sole exception of Dane County.
But this is not evidence of fraud, because those numbers don’t fulfill one of the basic requirements needed for Benford’s Law to apply, which is that the values have to fall across many orders of magnitude.
Next to the title of each chart I have a log10 range score for the numbers. I calculate these by binning the numbers by the floor of their base-10 logarithm, dividing bin sizes by the biggest bin size, and then summing these. For example, pretend our numbers are 9, 32, 49, 90, 106. The floor log10s are 0, 1, 1, 1, 2. The bin counts are one in the power 0 bin, three in the power 1 bin, one in the power 2 bin (1, 3, 1). The max of these bin counts is 3, so we divide them all by 3 to normalize, getting 0.33, 1, 0.33. Then take the sum: 0.33 + 1 + 0.33 = 1.66.
The terrible fits in the Democrat column all have pretty low scores - 1.2 or 1.3, indicating that the numbers barely span two orders of magnitude. This explains why these numbers don’t follow Benford’s Law.
However, in the Republican column we see some not-so-great scores (1.3, 1.5) that do, sort of, fit the law. I calculated p-values for each set of numbers to see how truly unexpected each result is.
So, nothing out of the ordinary here as far as I can tell.
2. Last digit distribution
3. Voter turnout histograms
4. Results vs. turnout and Churov’s Saw
The area of modern-day Boston between Massachusetts Avenue and Kenmore Square has no common name, despite being one of the city’s most important transport nodes. Beacon Street, Commonwealt